Query points
To demonstrate the features and workflow of BeeSpatial for evaluating spatial data across multiple sites, we used 59 sites in Pennsylvania, USA from McNeil et al 2020.
The coordinates for these points are available here.
Choose locations
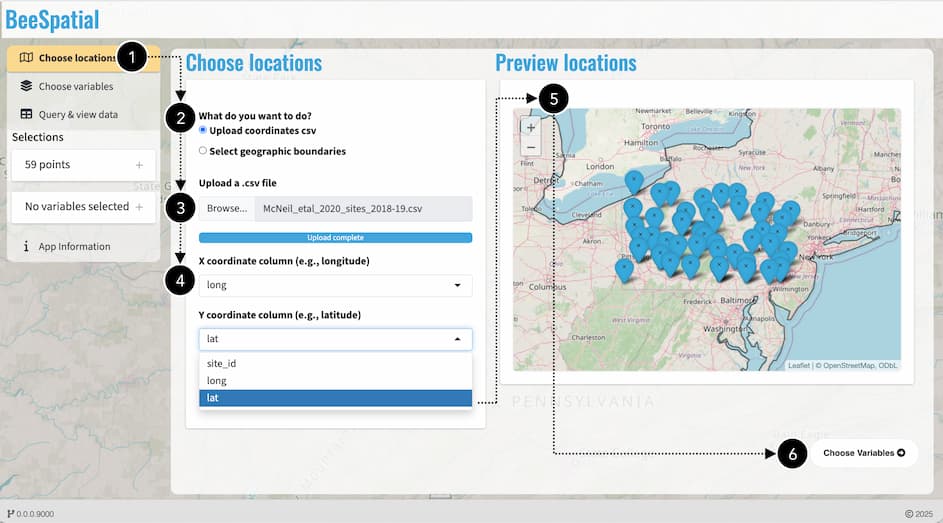
We uploaded the file containing the projected site coordinates in decimal degrees and confirmed the appropriate column names representing the longitude and latitudes as well as unique site identifiers. We then used the preview map to confirm that the locations were in the correct area and not outside of continental US where data are unavailable.
Choose variables
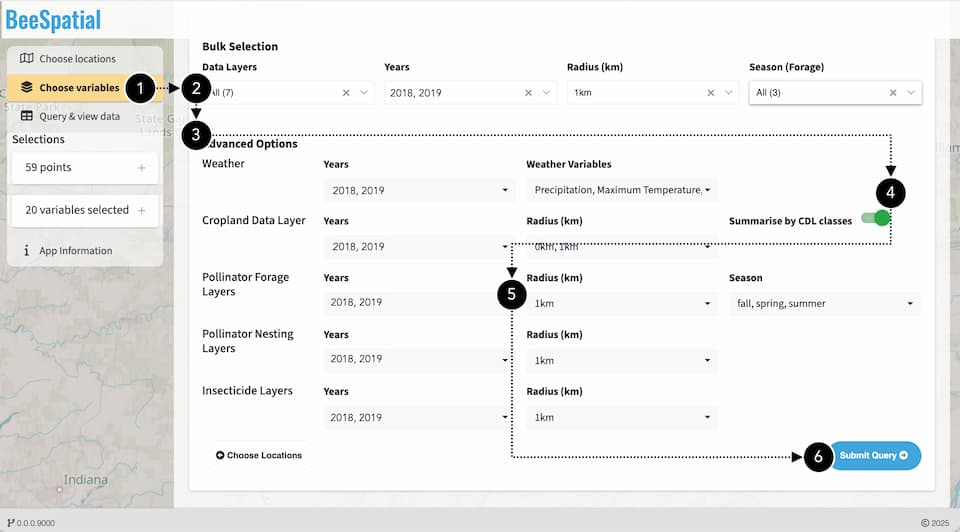
All available variable options for the years 2018 and 2019 were selected. A 1-km radius was applied to calculate landcover, forage, nesting, and insecticide indices around each location. The forage index was computed for the spring, summer, and fall seasons. Advanced options in BeeSpatial allow for customized combinations of years, radii, and, in the case of forage, seasons, although these were not modified in this example.
Query & view data
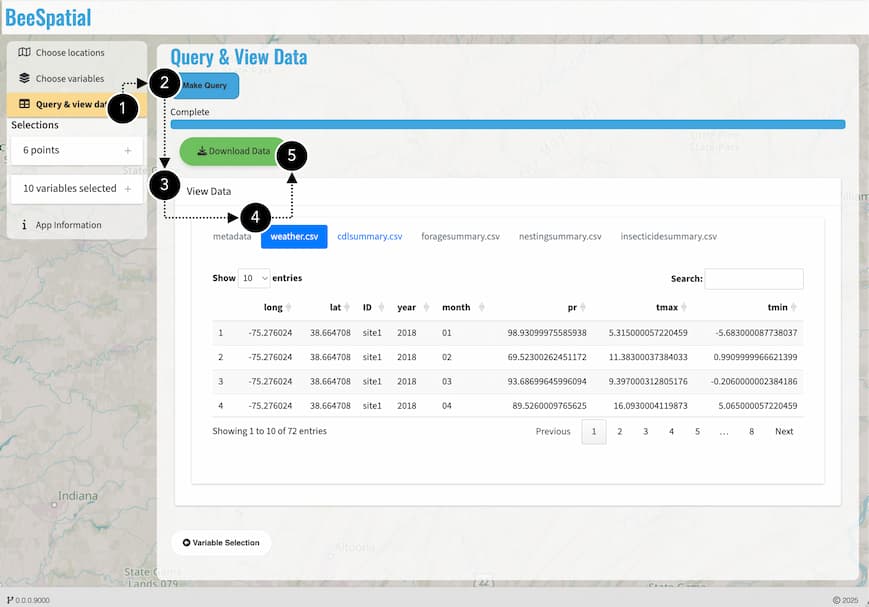
Data extraction and calculations for each location are completed after selecting “Make Query”, after which the resulting data tables can be previewed before downloading.